graphsmith
Free browser-based tools for creating charts, diagrams and converting images to vector files
A collection of 50 free online tools for making charts, diagrams, and vector graphics with no sign-up required
About this launch
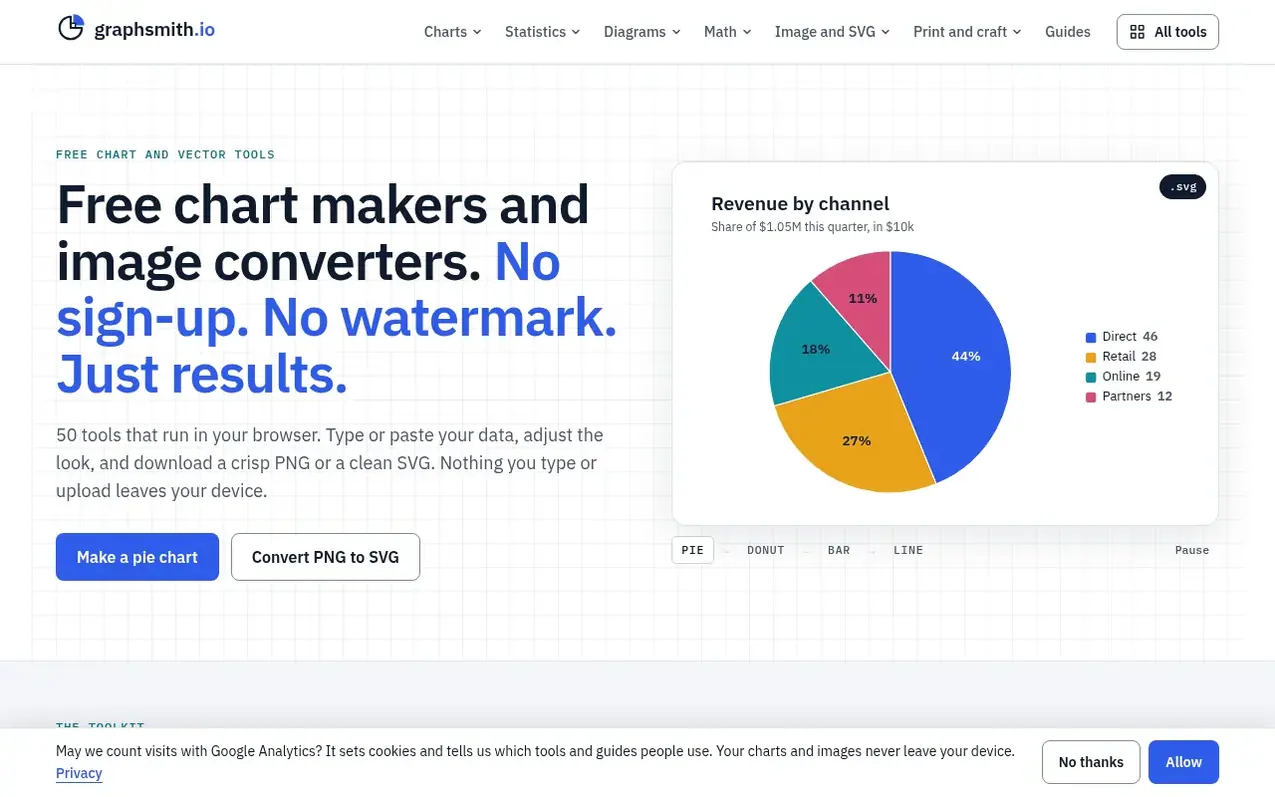
graphsmith is a collection of free browser-based tools for creating charts, diagrams, and graphics. Users can type or paste data, adjust the appearance, and export results as PNG or SVG vector files. The toolkit includes pie chart makers, bar and line graph generators, scatter plots, histograms, Venn diagrams, timelines, Gantt charts, and image-to-SVG converters. All processing happens on the user's device, with no data sent to servers. The tools require no account creation or installation, and all exports are available as vector files that can be edited in design software.
What it does
- Pie chart maker with percentages, labels and legend
- Bar graph maker with grouped, stacked and horizontal bars
- Line graph maker for trends over time with multiple series
- Scatter plot maker with line of best fit and R²
- Graphing calculator with equations, roots and intersections
- PNG to SVG converter with transparent background preservation
- Image vectorizer for photos, sketches and logos
- Gantt chart maker for project plans with dependencies
- Venn diagram maker for two or three sets
- SVG to PNG, JPG, PDF and other format converters
Pricing
Pricing model: Free
Shopper questions
How do I export my chart or image?
You can download a PNG at up to three times the size, an SVG vector file, or copy the image directly into your document. Every export is available as SVG with editable shapes and live text.
Is my data stored on your servers?
No. Every tool runs entirely in your web browser, and when you edit a chart or convert an image, the processing is done on your own device. The site does not receive your data, text, or images, and does not store them.
Can I use the charts I make for any purpose?
Yes. What you make is yours to use as you wish. The terms state that you retain ownership of the content you create.
What chart should I use for my data?
Start from the question you want the reader to answer. Use a pie chart for two to six parts of one total, a bar graph to compare amounts across categories, and a line graph to show how something changed over time.
Do I need to create an account or install anything?
No. There is no account to create and nothing to install. Every tool opens with an example you can edit, so you can see how it works before typing anything.
graphsmith has a free listing. The owner can unlock the full profile with a paid launch for $5:
- Founder story (locked)
- Milestones (locked)
- Demo video (locked)
- Dofollow website link (locked)
Shoppers also viewed
- AI Kitchen Design
Design tools
- ideare
Design tools
- Matita
Design tools
- Hyperiux Vault
Design tools