SmartPlot
Desktop scientific plotting and data analysis software for researchers
SmartPlot is desktop software for creating scientific plots and analyzing research data, with support for multiple plot types, styling, and export to
About this launch
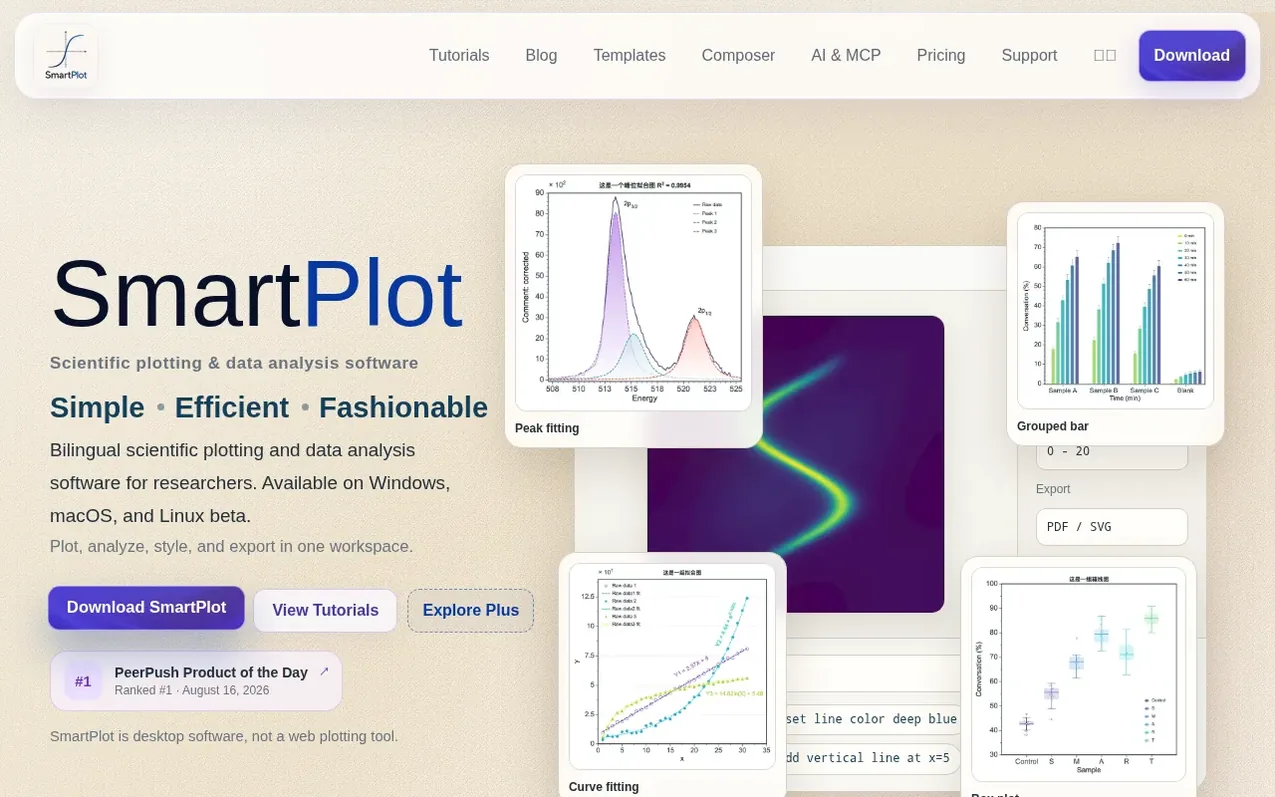
SmartPlot is a desktop application for scientific plotting and data analysis designed for researchers. It supports data import, organization, and plotting across Windows, macOS, and Linux beta. Users can create various scientific plot types, perform analysis including baseline correction, peak fitting, and trend fitting, and style figures with customizable colors, axes, and fonts. The software includes a Composer tool for creating multi-panel figures combining SmartPlot plots and external images, editable flowcharts with BPMN and UML shapes, and an AI-powered Smart Panel for describing analysis tasks. Both Free and Plus versions are available, with Plus offering advanced features like gradient palettes, additional plot types, and in-app AI with monthly S points.
What it does
- Data import from CSV, TXT, and other formats
- Advanced analysis tools including baseline correction, peak fitting, and curve fitting
- Figure composition tool for combining plots and images
- Editable flowcharts with BPMN and UML shapes
- In-app AI Smart Panel for analyzing data through conversation
- Export to PDF, SVG, PNG, JPG, TIFF, and PPTX formats
- Customizable color palettes and gradient colors
- Workflow template recording and reuse
- Bilingual interface supporting English and Chinese
Pricing
Pricing model: Freemium
Free version available. SmartPlot Plus: 1 person $8, 2 people $7 each, 3+ people $6 each. One-time purchase, does not expire, supports up to 3 active devices per license. Each Plus License includes 50,000 S points per month for AI usage.
Shopper questions
What is SmartPlot designed for?
SmartPlot is for researchers who want scientific figures to be easier to make, easier to polish, and nicer to look at. It focuses on the real plotting workflow with clear layouts, comfortable data styles, smoother export, and fewer steps between raw data and publication-ready figures.
Will the Free version disappear in the future?
No. The Free version will remain useful for everyday plotting, data organization, basic analysis, styling, and export. Plus adds richer visual styles, more palettes and gradients, reusable templates, saved workflows, and batch-oriented tools, but is not intended to replace the Free version.
Is SmartPlot a web application?
No. SmartPlot is desktop software. The website is for download, tutorials, pricing, and support. The actual plotting workflow happens in the installed app, making it easier to work with local research data and desktop files.
What is the difference between the Free and Plus versions?
Free is for making common scientific plots cleanly. Plus is for users who care more about visual polish and repeatable workflows, including more color and data styles, gradient palettes, reusable figure templates, saved analysis and export flows, and faster handling of similar datasets.
Does SmartPlot support Windows and macOS?
Yes. SmartPlot supports Windows and macOS, and Linux beta builds are now open for testing. The Mac experience receives special attention because many research users work there, while keeping the same figure workflow consistent across platforms.
SmartPlot has a free listing. The owner can unlock the full profile with a paid launch for $5:
- Founder story (locked)
- Milestones (locked)
- Demo video (locked)
- Dofollow website link (locked)
Shoppers also viewed
- Nuxt Dashboard
Design tools
- MyPaperKit
Design tools
- AI Kitchen Design
Design tools
- ideare
Design tools